
By: Retave’s Education Desk Editor
Malaysia’s Graduate Employment rate (GE) held steady in 2025, at 92.3% against 92.5% in 2024, according to the Ministry of Higher Education (MOHE).
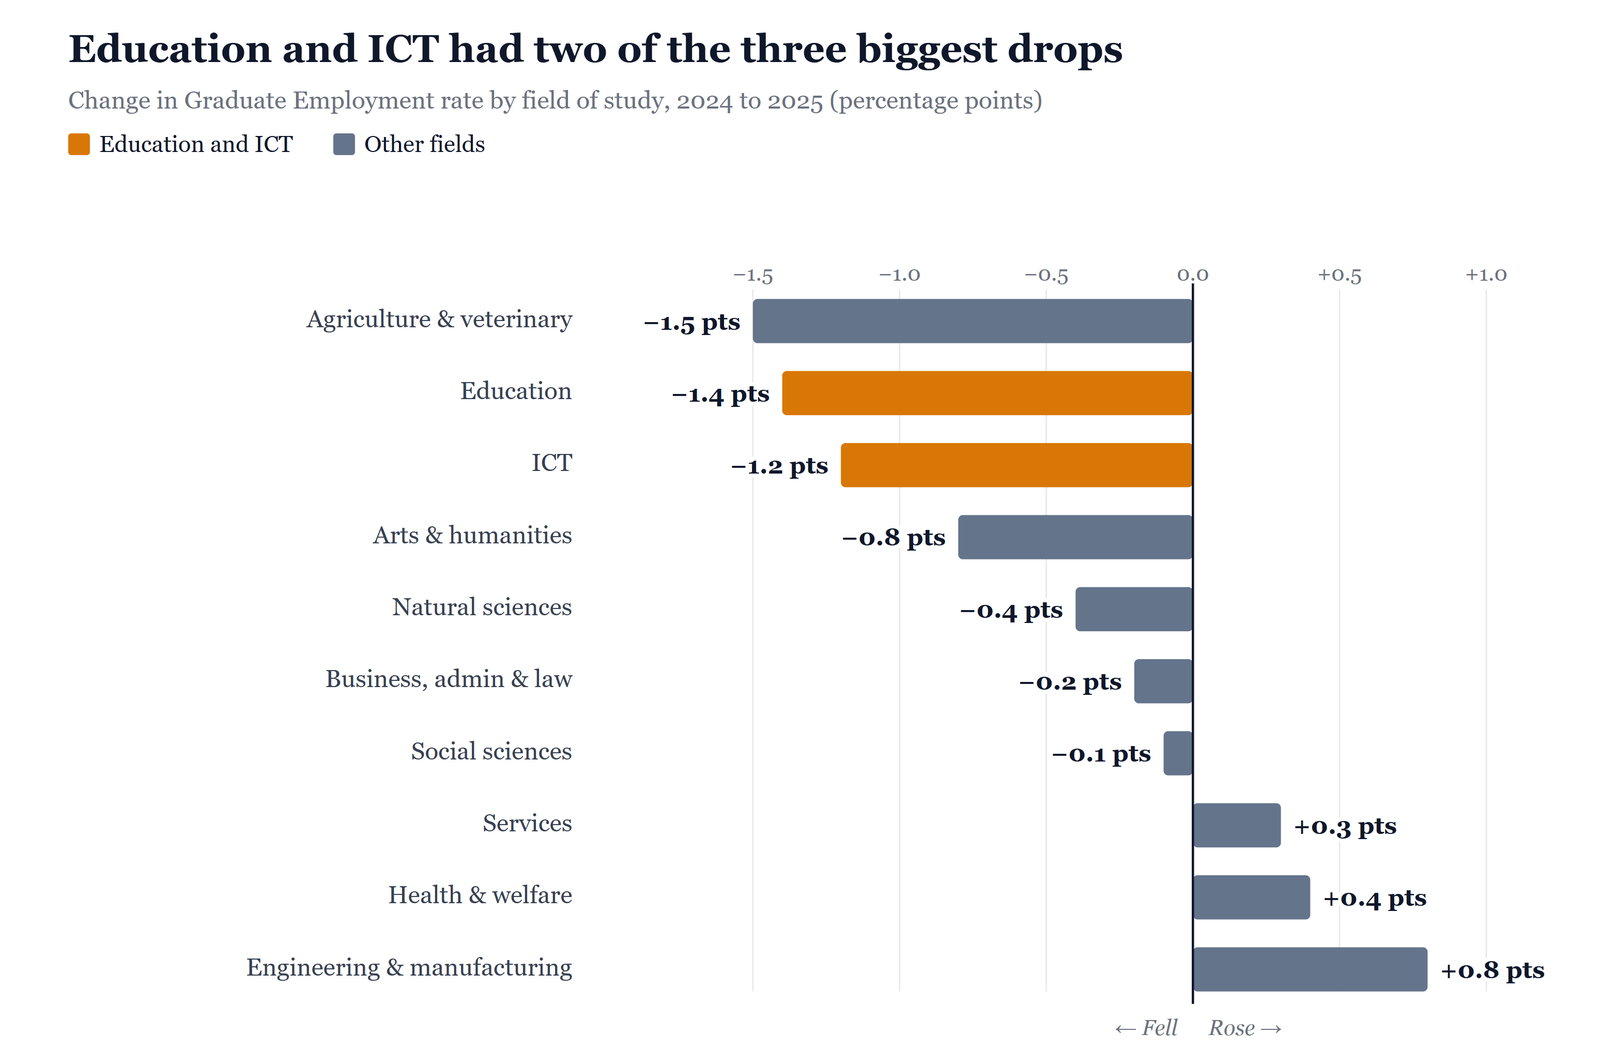
Most of the ten main fields of study moved by less than a point. Two stand out for their size: education and ICT, which together account for more than 40,000 of the graduates MOHE traced and saw two of the three largest dips. Agriculture moved by 1.5 points, with a cohort of 3,192 graduates, about a seventh the size of education’s.
More education graduates in work
MOHE’s tracer tables show 20,319 education graduates in work in 2025, nearly 2,400 more than the 17,961 a year earlier. The field’s rate was 88.4%, against 89.8% in 2024.
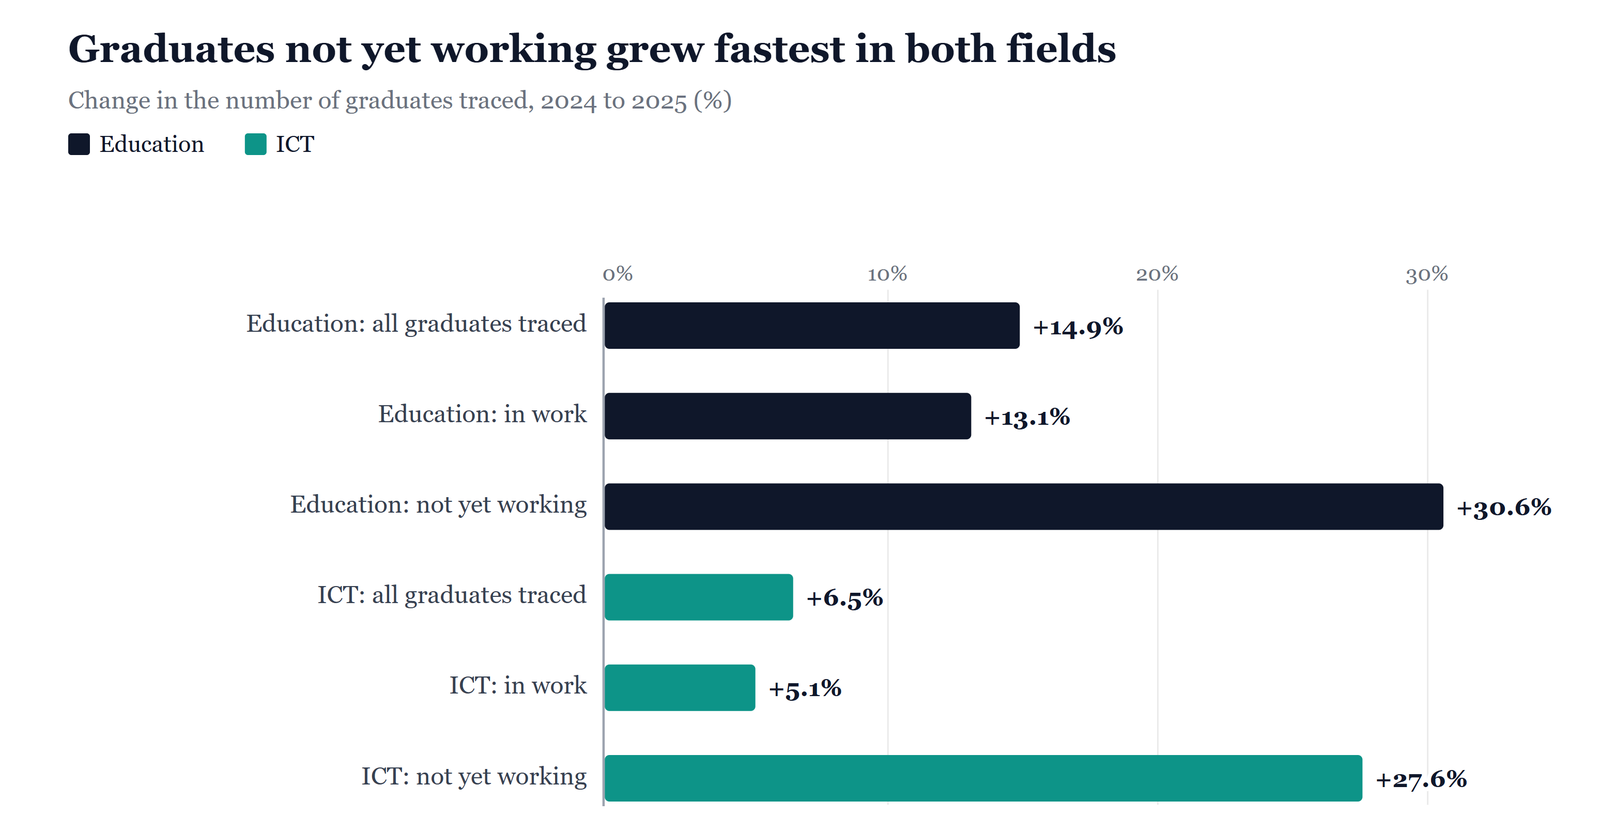
The cohort grew faster, though. The number of education graduates traced rose 14.9%, from 20,003 to 22,986, and those not yet working rose 30.6%, from 2,042 to 2,667. A rate can fall even while more people find jobs, if the group being measured grows faster.
A pipeline that’s still growing
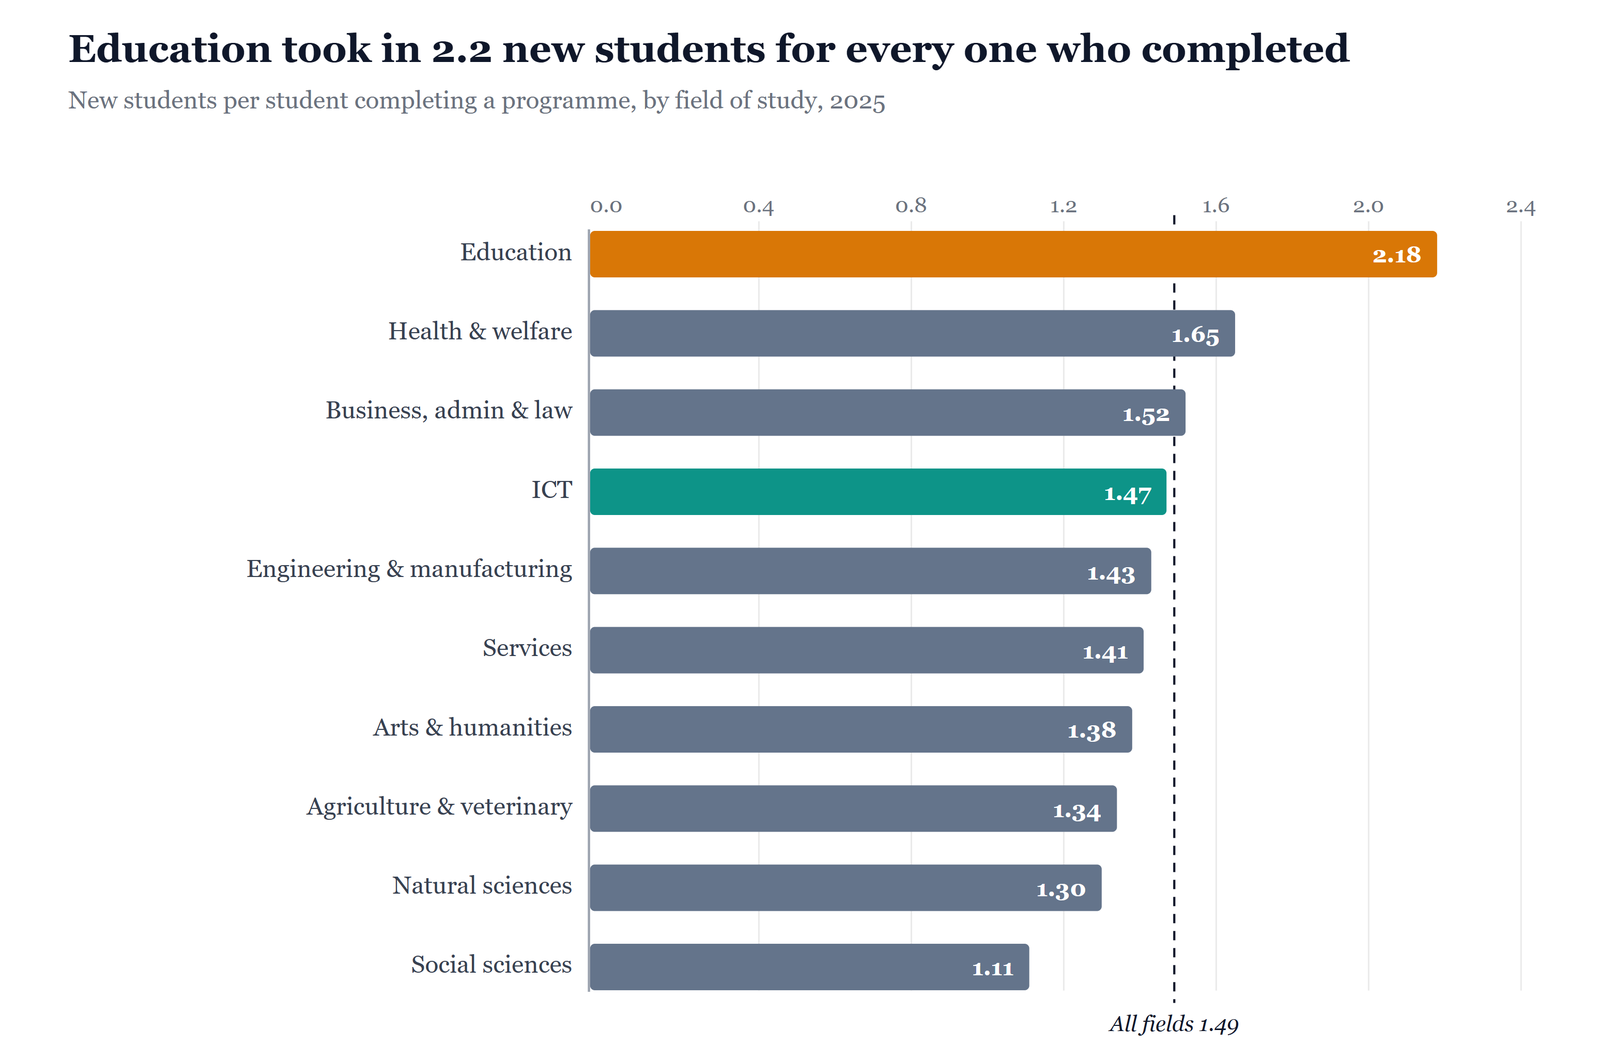
MOHE’s 2025 figures show 46,126 students entering education programmes, more than twice the number who completed one (21,173). No other main field comes close. Across all fields, about 1.5 students entered for every one who completed; in education, it was 2.2.
Most of that intake is at private institutions. Private higher education institutions took in 26,676 new education students in 2025, about three times the 8,924 who completed there. Public universities took in 19,450 and saw 12,249 complete.
Programmes run for different lengths, so these ratios aren’t a forecast, though intake at this level points to a growing supply of new education graduates in the years ahead.
ICT, a field employers keep asking for
TalentCorp’s Malaysia Critical Occupations List (MyCOL) 2024/2025 lists 66 occupations where employers report shortages, and by RETAVE’S count, 10 of them are ICT roles, from software developers and data professionals to cybersecurity professionals. Three of them, ICT managers, software developers and information technology system administrators, have been on the list in every edition since 2015.
More ICT graduates were in work in 2025: 15,767, up from 14,998. The field’s rate moved from 93.7% to 92.5% as the number of ICT graduates traced grew 6.5%, from 15,998 to 17,043, and those not yet working rose from 1,000 to 1,276.
MyCOL’s findings point to where programmes can help. According to TalentCorp, employers want more job-ready candidates and qualifications that match workplace needs, and for software developers, one of the strategies employers listed was hiring applicants with fewer formal qualifications.
The ICT pipeline is also large. In 2025, 45,175 students entered ICT programmes, more than half of them (24,341) at private institutions and 4,177 at polytechnics and community colleges.
Reading the table well
- Two years make a comparison, not a trend. A one-point move in a single year may reverse in the next.
- The rate counts any job. It doesn’t show whether the work matches the field, sits at a skilled level, or pays well. The yearbook’s tracer tables don’t include salaries.
- The groups change. The number of graduates traced in each field differs from year to year, so each rate describes that year’s cohort.
- The fields are broad. Health and welfare, for instance, group many different programmes, and these tables don’t split them.
- Older figures were measured differently. Since 2024, MOHE has reported the employment rate separately from a broader marketability rate, which also includes graduates who are studying further, upskilling, or awaiting placement. Keep that in mind when comparing with years before 2024.
- Intake and output figures cover MOHE’s own institutions: public universities, private institutions, polytechnics and community colleges. The tracer data also includes graduates of institutions under other ministries.
Used this way, the table is a useful signal for a closer look at each programme.
Where to look next
If you run an education or ICT programme, the most useful comparison is your own programme against its field average: 88.4% for education and 92.5% for ICT. A programme above its field average can show what is working, and one below it has a clear starting point for its careers office and industry partners.
For education, it’s also worth asking how many of your graduates are working as teachers, and how that compares with your intake plans for the next few years. For ICT, MyCOL’s occupation list is a practical checklist of 10 roles to map against the curriculum.
The next edition of these tables, for 2026, will show how the large intakes in both fields carry through into work.
Further Reading
- Inside Malaysia’s graduate tracer study: what the 92.3% employment rate counts, and where pay comes in
- One in three, and two in three under 25: what DOSM’s latest numbers say about skill-related underemployment
- Nearly six in ten entrants to public universities chose STEM. But more than a quarter of Malaysia’s critical occupations sit below degree level
Sources
- Ministry of Higher Education Malaysia. (n.d.). Statistik pendidikan tinggi 2024: Bab 7 [Statistics of higher education 2024: Chapter 7]. https://mohe.gov.my/en/download/statistics/2024-4/1708-bab-7-tracer-study-2024-pdf/file
- Ministry of Higher Education Malaysia. (2026). Statistik pendidikan tinggi 2025: Bab 7 [Statistics of higher education 2025: Chapter 7]. https://mohe.gov.my/en/download/statistics/2025-1-1/1845-bab-7-skpg-2025-pdf/file
- Ministry of Higher Education Malaysia. (2026). Statistik pendidikan tinggi 2025: Bab 1 [Statistics of higher education 2025: Chapter 1]. https://mohe.gov.my/en/download/statistics/2025-1-1/1851-bab-1-makro-2025-pdf/file
- TalentCorp Malaysia. (n.d.). MyMahir Malaysia Critical Occupations List (MyCOL) 2024/2025 [Brochure]. https://www.talentcorp.com.my/images/uploads/publication/205/MyMahir-MyCOL-20242025-Brochure-1773377416.pdf
- Universiti Teknologi Malaysia. (2025, April 13). UTM catat 100% bagi Kadar Bekerja Graduan (GE) dan Kadar Kebolehpasaran Graduan (GM). https://news.utm.my/2025/04/utm-catat-100-bagi-kadar-bekerja-graduan-ge-dan-kadar-kebolehpasaran-graduan-gm-warganegara/